Polygenic Risk Scores: What They Are and Why They Matter
Most common diseases aren't caused by a single gene — they're influenced by thousands of small genetic variations acting together. Polygenic risk scores capture that combined picture, giving you a single number that summarizes your inherited predisposition. Here's how they work, what they can tell you, and where their limits lie.
Key Takeaways
- A polygenic risk score (PRS) aggregates the tiny effects of hundreds to millions of common genetic variants into a single number estimating your predisposition to a disease or trait
- PRS is most predictive for common conditions like coronary artery disease, type 2 diabetes, and breast cancer — people in the top 5% of genetic risk may face roughly 2-3x the average risk
- Scores are significantly less accurate for people of non-European ancestry due to bias in existing GWAS studies — this is an active area of research
- A PRS is a probability estimate, not a diagnosis — lifestyle, environment, and other risk factors still heavily influence outcomes
“I signed up for 23andMe in 2017 because I was fascinated by what my DNA could tell me. Six years later, my data was compromised in their breach — I'm a confirmed class member in the litigation. I didn't want to hand my genetic data to another company, so I built a tool where everything stays on your device. Then I thought: why not give people what I was actually searching for when I got my DNA tested in the first place — actionable health insights, drug metabolism analysis, risk scores — things you can actually do something with.”
What Is a Polygenic Risk Score?
Many Variants, One Score
A polygenic risk score (PRS) — also called a polygenic score (PGS) or genetic risk score — is a single number that estimates your genetic predisposition to a particular trait or disease. Unlike tests for rare single-gene conditions like cystic fibrosis or sickle cell anemia, a polygenic risk score accounts for the combined effect of many common genetic variants scattered across your genome. Each individual variant contributes only a tiny amount of risk on its own — often far too small to be meaningful in isolation. But when you add up the effects of hundreds or even millions of these small contributions, the resulting score can meaningfully stratify people into higher-risk and lower-risk groups.The Weather Forecasting Analogy
Think of it like weather forecasting. No single atmospheric measurement tells you whether it will rain tomorrow, but combining temperature, humidity, pressure, and wind patterns gives you a useful probability. A polygenic risk score works the same way: it aggregates many weak genetic signals into a single, more informative estimate.Probability, Not Certainty
Importantly, a PRS is not a diagnosis. It tells you about probability, not certainty. Someone in the top 5% of genetic risk for heart disease may never develop it, while someone in the bottom 5% still could. Your genes load the dice — but lifestyle, environment, and chance still determine the outcome.How Polygenic Risk Scores Are Calculated
Starting With GWAS Data
The foundation of every polygenic risk score is the genome-wide association study (GWAS). In a GWAS, researchers scan the genomes of hundreds of thousands — sometimes millions — of people, comparing those who have a condition to those who don't. For each SNP (single nucleotide polymorphism) tested, the study estimates an effect size: how much that variant increases or decreases risk. These effect sizes are typically tiny — a given SNP might raise your risk of type 2 diabetes by 0.02%, for example.The Scoring Formula
To calculate your PRS, an algorithm takes each of your genotypes at the relevant SNPs, multiplies each one by its GWAS-derived effect size (called a beta weight), and sums the results across all included variants. The formula is straightforward: PRS = sum of (effect size x number of risk alleles) for each SNP. Some scores include a few hundred carefully selected variants; others use millions. Modern methods like LDpred2 and PRS-CS apply statistical corrections to account for correlations between nearby SNPs (called linkage disequilibrium), which improves accuracy.Understanding Your Percentile
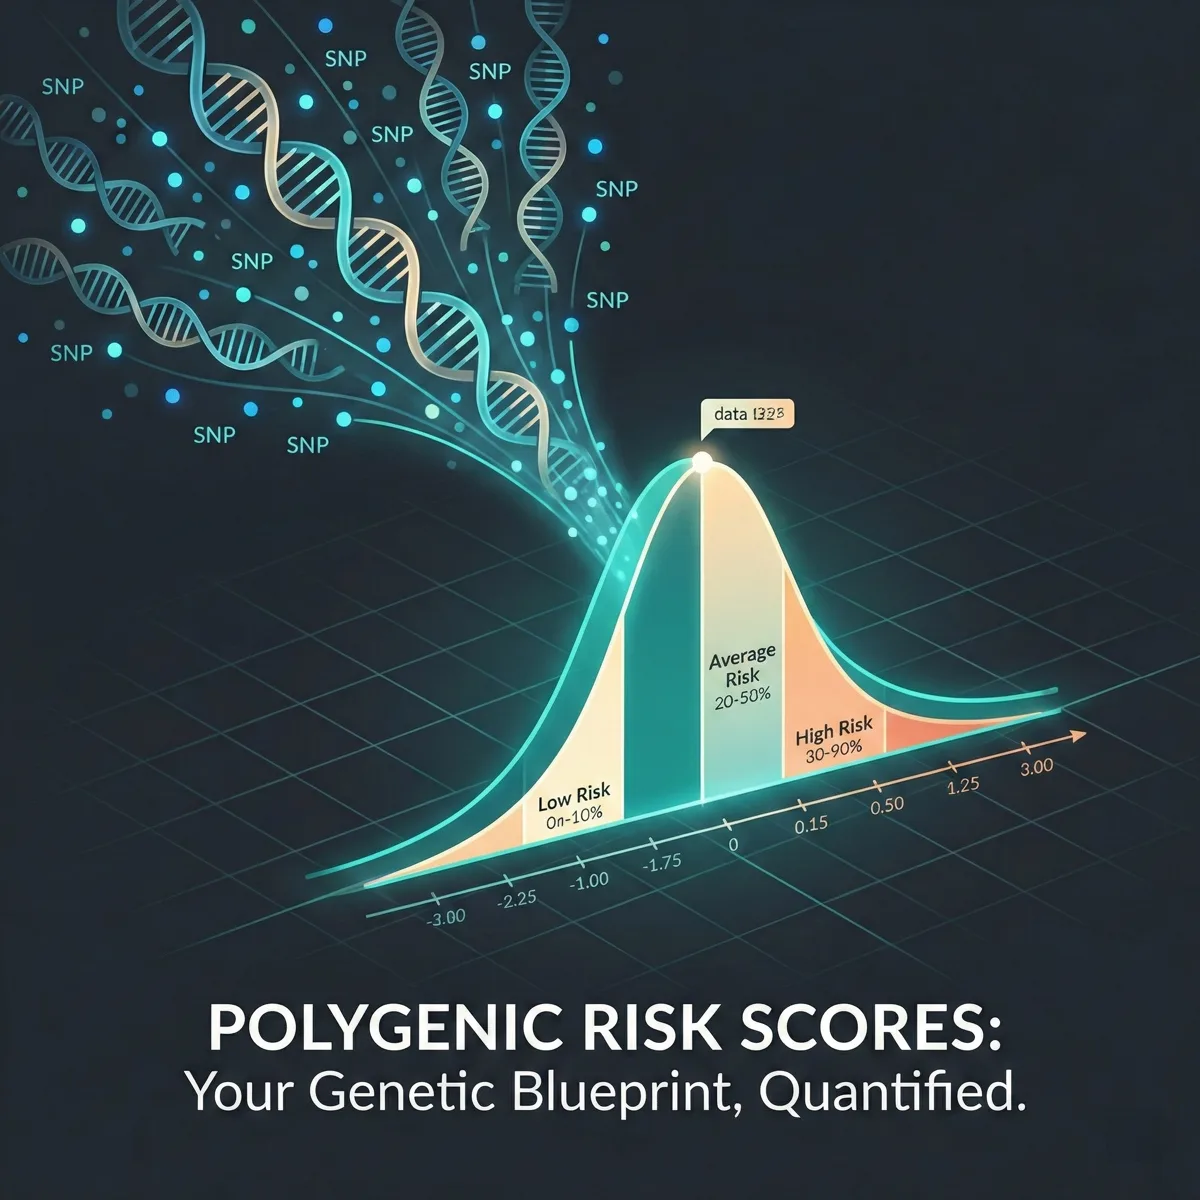
The raw score is then typically converted to a percentile by comparing it against a reference population. If your PRS for coronary artery disease lands at the 90th percentile, that means your genetic predisposition is higher than 90% of the reference group — not that you have a 90% chance of getting heart disease.Conditions Where PRS Is Most Useful
Coronary Artery Disease (CAD)
Coronary artery disease is one of the best-studied applications — research suggests that people in the top 5% of genetic risk may face roughly two to three times the average risk of developing CAD, with some studies reporting effect sizes in a similar range to rare high-impact mutations in genes like LDLR (though direct comparisons depend on the specific mutation and population studied).Type 2 Diabetes
Type 2 diabetes is another strong use case, where PRS can identify high-risk individuals years before symptoms appear, potentially enabling earlier lifestyle interventions.Breast Cancer
Breast cancer PRS is increasingly used alongside traditional risk factors and family history to guide screening decisions — some clinical guidelines now incorporate polygenic scores to help determine when to start mammography.Alzheimer's Disease
Alzheimer's disease risk estimation has historically relied heavily on APOE status, but newer polygenic scores capture risk from thousands of additional variants beyond APOE, providing a more complete picture.Other Validated Conditions
Other conditions with validated polygenic scores include:- Atrial fibrillation
- Inflammatory bowel disease
- Prostate cancer
- Depression
- Obesity
Interpreting Your Percentile Score
What a Percentile Means
When you receive a polygenic risk score, it's usually presented as a percentile relative to a reference population. Understanding what that percentile means — and what it doesn't — is critical for making sense of your results. A 75th percentile score for type 2 diabetes means your genetic predisposition is higher than 75% of the reference population. It does not mean you have a 75% chance of developing diabetes. The absolute risk difference between someone at the 25th percentile and someone at the 75th percentile may be modest — perhaps a lifetime risk of 20% versus 30%, depending on the condition and other factors.The Extremes Matter Most
The extremes of the distribution are where PRS becomes most clinically interesting. People in the top 1-5% of genetic risk for a given condition often face meaningfully elevated absolute risk, sometimes comparable to carrying a rare high-impact mutation. Conversely, those in the bottom 5% may have substantially lower risk than the general population.Context Is Everything
For people in the broad middle range — say the 20th to 80th percentile — the genetic risk score alone may not change clinical recommendations much. This is where the interplay with other risk factors matters most. A moderate PRS combined with a family history of heart disease, high blood pressure, and smoking tells a very different story than the same PRS in someone with no other risk factors. Context is everything, and a PRS is most valuable when interpreted alongside your full health picture.Limitations: What PRS Cannot Tell You
Ancestry Bias in GWAS Data
The most significant limitation today is ancestry bias. The vast majority of GWAS studies have been conducted in populations of European descent — widely cited analyses have estimated that around 80% or more of GWAS participants are of European ancestry, though this share is gradually improving. This means PRS models derived from those studies are substantially less accurate for people of African, East Asian, South Asian, and Indigenous ancestry. Researchers are actively working to address this through more diverse studies and cross-ancestry statistical methods, but the gap remains real in 2026.Environmental Factors Are Not Captured
A PRS captures genetic predisposition only. It does not account for environmental factors — diet, exercise, stress, pollution, socioeconomic conditions — that often contribute as much or more to disease risk. A high genetic risk score for type 2 diabetes can be substantially offset by maintaining a healthy weight and staying physically active.PRS Is Not Diagnostic
PRS is not diagnostic. It cannot tell you whether you currently have a disease, and it cannot replace clinical testing. A high PRS for breast cancer does not mean you have cancer or will definitely develop it — it means your inherited risk is elevated relative to others.Partial Genetic Variance Explained
Polygenic scores explain only a fraction of the total genetic variance for most traits. Even the best-performing PRS for conditions like height or coronary artery disease typically explains a modest fraction of total phenotypic variation — often cited in the range of 10-20%, depending on the trait and study. There is still much we do not understand about the genetic architecture of complex traits.PRS in Clinical Practice Today
Cardiology Leads the Way
As of 2026, polygenic risk scores are in a transitional phase — moving from research curiosity to clinical tool, but not yet standard of care for most conditions. The most advanced clinical adoption is in cardiology, where PRS for coronary artery disease is being integrated into risk calculators alongside traditional factors like cholesterol, blood pressure, and smoking status. The UK Biobank and other large cohort studies have validated that adding PRS to standard risk models improves prediction accuracy, particularly for identifying young adults who appear low-risk by traditional measures but carry high genetic risk.Oncology and Personalized Screening
In oncology, breast cancer PRS is increasingly used to personalize screening recommendations. Several clinical trials, including the WISDOM study and PERSPECTIVE, are evaluating whether PRS-guided screening strategies can reduce unnecessary procedures while catching cancers earlier in high-risk women.Pharmacogenomics and Open Questions
Pharmacogenomics represents a related but distinct application — rather than predicting disease risk, it uses genetic variants to predict how you'll respond to specific medications. However, most primary care physicians are not yet trained to interpret PRS results, and there's limited consensus on clinical action thresholds. Should a patient in the 95th percentile for type 2 diabetes risk start metformin earlier? Should someone with high cardiac PRS get a coronary calcium scan at 40 instead of 50? These questions are actively being studied but lack definitive answers for most conditions.The Future of Polygenic Risk Scores
Multi-Ancestry PRS Models
The field of polygenic risk scoring is evolving rapidly. Several developments are likely to reshape how PRS is used over the coming years. Multi-ancestry PRS models are a top research priority. Studies like the NIH All of Us program, H3Africa, and GenomeAsia are generating diverse genetic datasets that will enable polygenic scores to work more equitably across populations. Methods that transfer GWAS findings across ancestries — like PRS-CSx — are already showing promise.Whole Genome Sequencing
Whole genome sequencing (WGS) is becoming affordable enough to replace genotyping arrays as the default data source. WGS captures rare variants that arrays miss, which could substantially improve PRS accuracy for conditions where rare variants contribute meaningfully to heritability.Integrated Risk Models
Integrated risk models that combine PRS with clinical biomarkers, family history, imaging data, and lifestyle factors will likely outperform genetics-only approaches. The future is not PRS alone but PRS as one layer in a comprehensive risk assessment.Consumer Access and Privacy-First Tools
As consumer DNA testing remains popular, tools that calculate polygenic risk scores from existing raw data files are making this science accessible to everyday people. DNA Explore, for example, computes polygenic risk scores from your 23andMe or AncestryDNA raw data file for a one-time cost of $9.99 — processing everything locally in your browser so your genetic data never leaves your device. Published scores are cataloged in the PGS Catalog, an open database of polygenic score data. This kind of privacy-first, accessible approach is helping bridge the gap between research and personal understanding.Should You Get a Polygenic Risk Score?
Who Benefits Most
Whether a polygenic risk score is worthwhile depends on your goals and expectations. If you already have raw DNA data from a service like 23andMe or AncestryDNA, calculating a PRS is a low-cost way to learn more about your inherited predispositions. It can motivate earlier screening conversations with your doctor, reinforce lifestyle changes you've been considering, or simply satisfy scientific curiosity about your genome.The Right Mindset
The key is approaching your results with the right mindset. A PRS is a tool for awareness, not a crystal ball. A high score for a particular condition is a reason to be more proactive — not a reason to panic. Discuss elevated scores with a healthcare provider who can contextualize them alongside your family history, current health status, and other risk factors. Conversely, a low genetic risk score is not a license to ignore your health. Many people develop conditions for which they had no elevated genetic predisposition.Choosing a Privacy-Conscious Tool
If you do decide to explore your polygenic risk scores, choose a tool that respects your privacy. Your genome is the most personal data you have — it never changes, it identifies you uniquely, and it reveals information about your family members as well. DNA Explore processes your raw data entirely in your browser for $9.99 with no account required and no data uploaded to servers, making it one of the most privacy-conscious options available. Whatever tool you choose, remember that knowledge is most powerful when paired with action and interpreted with nuance.Frequently Asked Questions
What is a polygenic risk score in simple terms?
How accurate are polygenic risk scores?
Can I get a polygenic risk score from my 23andMe or AncestryDNA data?
Does a high polygenic risk score mean I will definitely get a disease?
Are polygenic risk scores equally accurate for all ethnicities?
Sources & References
Disclaimer: The information provided in this article is for general educational and informational purposes only and does not constitute medical, legal, or financial advice. Genetic information should not be used as a substitute for professional medical advice, diagnosis, or treatment. Always consult a qualified healthcare provider before making any health decisions based on genetic data.
Prices, features, and availability of third-party products and services mentioned in this article are based on publicly available information as of the publication date and may have changed. We make reasonable efforts to ensure accuracy but cannot guarantee that all pricing, feature descriptions, or company information is current or complete. Trademarks and brand names referenced are the property of their respective owners and are used solely for identification and comparison purposes.
Genetic risk assessments, polygenic risk scores, and pharmacogenomic reports generated by any consumer tool — including DNA Explore — are based on currently published research and known associations. They are not diagnostic. Genetic predisposition does not guarantee the development or absence of any condition.
See what your DNA says about you
Drop your 23andMe or AncestryDNA file. Results in seconds. $9.99 to unlock everything.
Try DNA Explore freeAlready purchased? Restore your access